
Intro: Why a Simple Scoring Matrix Helps You Select Investments (Without the Guesswork)
If you’ve ever felt whiplash jumping between deals, tokens, and funds, you’re not alone. The fastest way to cut noise and bias is to turn decisions into a lightweight, repeatable scoring matrix. In this guide, you’ll use a simple framework to select invest opportunities based on three practical levers - risk, liquidity, and thesis fit - so you can invest select with clarity, document why you chose each position, and stay accountable as markets move.
"Over the 10 years ending 2023, the average dollar invested in U.S. funds earned 6.3% annually - about 1.1 percentage points less than the average fund’s 7.3% - primarily due to timing decisions." - Source
That timing gap is the cost of gut feel. A scoring matrix closes it by forcing consistent inputs and transparent trade-offs.
Here’s what you’ll get:
A crisp, 3-criteria matrix you can run in minutes to rank any asset against your investment thesis - founder-led venture deals, liquid yield, or both.
A shared language for founders, angels, DAOs, and retail contributors to compare options side-by-side, align on the why behind your investment, and keep records for future post‑mortems.
A system that slots neatly into your investment portfolio: use it to green‑light venture‑style bets with milestone proof, or to park idle capital into liquid yield while you wait for the next round.
How it fits your workflow:
Venture bets: Score risk (execution, market), liquidity (time to exit/secondary), and thesis fit (founder, market, moat). Use it to select invest opportunities that match your mandate and document tranche decisions.
Yield parking: Apply the same lens to liquidity layers and stable yield options - so when you invest, select instruments that stabilize cash flow without straying from your thesis.
By the end of this piece, you’ll have a plug‑and‑play matrix that lives in your stack, strengthens your investment portfolio, and helps you make each decision once - on purpose.
What Is an Investment Decision Matrix? (And Why It Beats Gut Feel)
An investment decision matrix turns messy choices into measurable ones. You pick the criteria that matter (e.g., risk, liquidity, thesis fit, optional catalysts), assign weights to each, score every opportunity, and roll those into a single comparable total - a rank order you can act on. That way, when you select invest opportunities, you’re using the same yardstick every time instead of chasing hype.
"A disciplined decision-making process with checklists and challenge can reduce cognitive biases." - Source
Core principles applied to investing:
Objectivity: Convert subjective opinions into scores tied to your investment thesis.
Clarity: One page that shows why an asset ranks higher in your investment portfolio - no hand‑waving.
Consistency: The same criteria and weights across deals, so you can invest select decisions on evidence, not emotion.
Why this beats generic prioritization frameworks:
vs. generic project scoring: Purpose‑built for assets, not tasks - weights reflect risk, liquidity, and thesis fit, not generic effort/impact.
vs. Eisenhower/GE/BCG: Those categorize; this quantifies. You get numeric comparability across venture rounds, tokens, and yield instruments.
vs. RICE/ICE: Those optimize features; this evaluates investable assets with capital at risk, adding liquidity and downside controls, plus optional catalysts (e.g., milestone unlocks, launches, revenue proofs).
When to use it:
New deal intake: Standardize how opportunities get scored and triaged.
Quarterly rebalancing: Re‑score positions as risk/liquidity/thesis fit shift.
Exit checks: Validate sell/hold with the same matrix you used to buy.
Documentation: Capture your investment rationale so future‑you (and partners) can audit decisions.
Outcomes you can expect:
Faster invest select calls with fewer meetings and less bias.
A cleaner pipeline view of what to fund now, park later, or pass on.
On‑chain auditability when paired with platforms like Zemyth - scores, milestones, and tranche logic recorded transparently alongside your investment.
Build Your Simple Scoring Matrix (Risk • Liquidity • Thesis Fit)
Step 1: Define the decision objective
Examples:
“Select invest option for next 90 days of idle capital.”
“Rank three startup rounds for Q1 deployment.”
Make it specific and time-bound so your investment matrix stays focused on one decision.
Step 2: Choose 3–5 criteria (keep it simple)
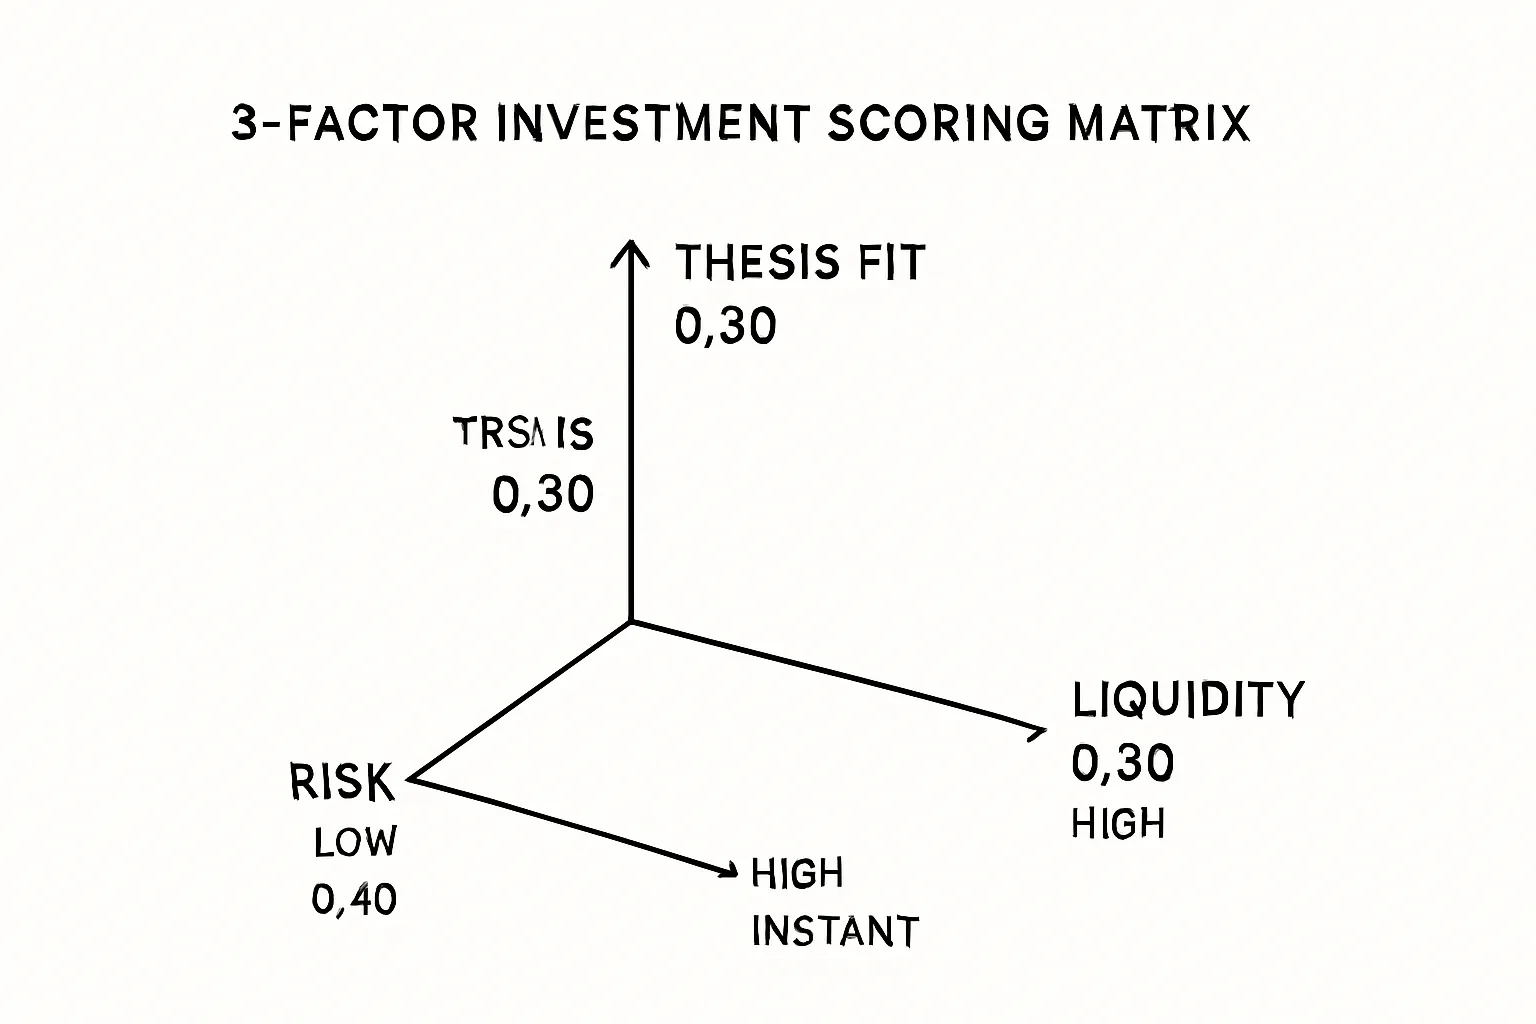
Core three for most portfolios:
Risk: Downside and operational/execution risk.
Liquidity: How quickly you can exit or rebalance.
Thesis Fit: Alignment with your mandate and edge.
Optional adds:
Catalyst/Timeline: Upcoming events (product launch, milestone unlock, listing).
Expected Return: Forward return vs. risk/volatility.
On‑chain Proof (Web3/venture): Audits, milestone proofs, revenue on-chain, contributor reputation.
Step 3: Weight the criteria
Use a 100‑point or 1.0 total weight system. Keep the math fast and comparable.
Examples:
Yield‑tilted (capital parking and flexibility)
Risk 0.40, Liquidity 0.40, Thesis Fit 0.20
Growth‑tilted (venture upside with milestones)
Thesis Fit 0.40, Risk 0.30, Liquidity 0.20, Catalyst 0.10
Criteria & Weight Setup:
Criterion | Definition (investing context) | Suggested Weight Range (Yield‑tilted vs Growth‑tilted) | Example Data Sources |
|---|---|---|---|
Risk | Probability/magnitude of loss across market, credit/counterparty, execution, and smart‑contract/operational risk | 30–50% vs 20–40% | Audits, credit ratings, treasury alloc docs, historical drawdowns, code reviews, multisig/guardian policies |
Liquidity | Speed/certainty of exit and slippage under stress | 30–50% vs 10–30% | Order book depth, AMM TVL, redemption windows, lockups, secondary market volume, T+ settlement terms |
Thesis Fit | Alignment with your mandate, edge, and sector focus | 10–30% vs 30–50% | Internal mandate docs, ICP notes, market maps, board/IC criteria |
Catalyst/Timeline (optional) | Near‑term events that can change risk/return | 0–10% vs 5–15% | Product/milestone roadmaps, exchange calendars, governance proposals |
Expected Return (optional) | Forward return vs. risk budget | 0–10% vs 5–15% | Pro forma models, implied APY/APR, comps, scenario analysis |
On‑chain Proof (optional) | Verifiable progress: revenue, users, milestones | 0–10% vs 5–15% | On‑chain analytics, milestone attestations, oracle feeds, Dune dashboards |
Step 4: Score each option consistently
Use a 1–5 (or 1–10) scale. Define anchors upfront to prevent bias.
Liquidity:
5 = T+0 exit, deep liquidity; 3 = weekly/limited; 1 = 12+ months lock or thin book.
Risk:
5 = Audited/overcollateralized, robust governance, diversified counterparties; 3 = partially audited/medium complexity; 1 = unaudited/opaque concentration.
Thesis Fit:
5 = Exact mandate match with clear edge; 3 = partial overlap; 1 = off‑mandate.
Catalyst (optional):
5 = High‑confidence catalyst <30 days; 3 = plausible in 90 days; 1 = speculative/no timing.
Expected Return (optional):
5 = Strong risk‑adjusted premium vs. baseline; 3 = moderate; 1 = weak/negative carry.
On‑chain Proof (optional):
5 = Verifiable revenue/users + milestone proofs; 3 = partial proofs; 1 = unverifiable claims.
Step 5: Calculate weighted totals and rank
For each opportunity: weighted score = Σ(weight × score per criterion).
Sort by total score to invest select quickly, then pressure‑test the top candidates.
Step 6: Sanity checks and red flags
Balance: No single dimension should dominate unless intentional. Cap any single criterion at 50% unless policy dictates otherwise.
Fragility: If Liquidity ≤2 and Risk ≤2, require extra justification or reject.
Correlation: Avoid top picks that are highly correlated unless that’s part of your strategy.
Add execution rules post‑selection:
Position sizing by risk bucket.
Stop‑loss or drawdown guards.
Rebalance triggers on catalyst outcomes or liquidity changes.
Step 7: Log the decision
Save the matrix, inputs, and links to data (audits, dashboards, liquidity snapshots).
Record who approved and why; set a review date (e.g., 30/90 days).
This turns your investment into a documented, repeatable process - making it easier to select invest opportunities, defend your investment portfolio moves, and improve over time.
Examples: Rank Three Investment Options with the Matrix
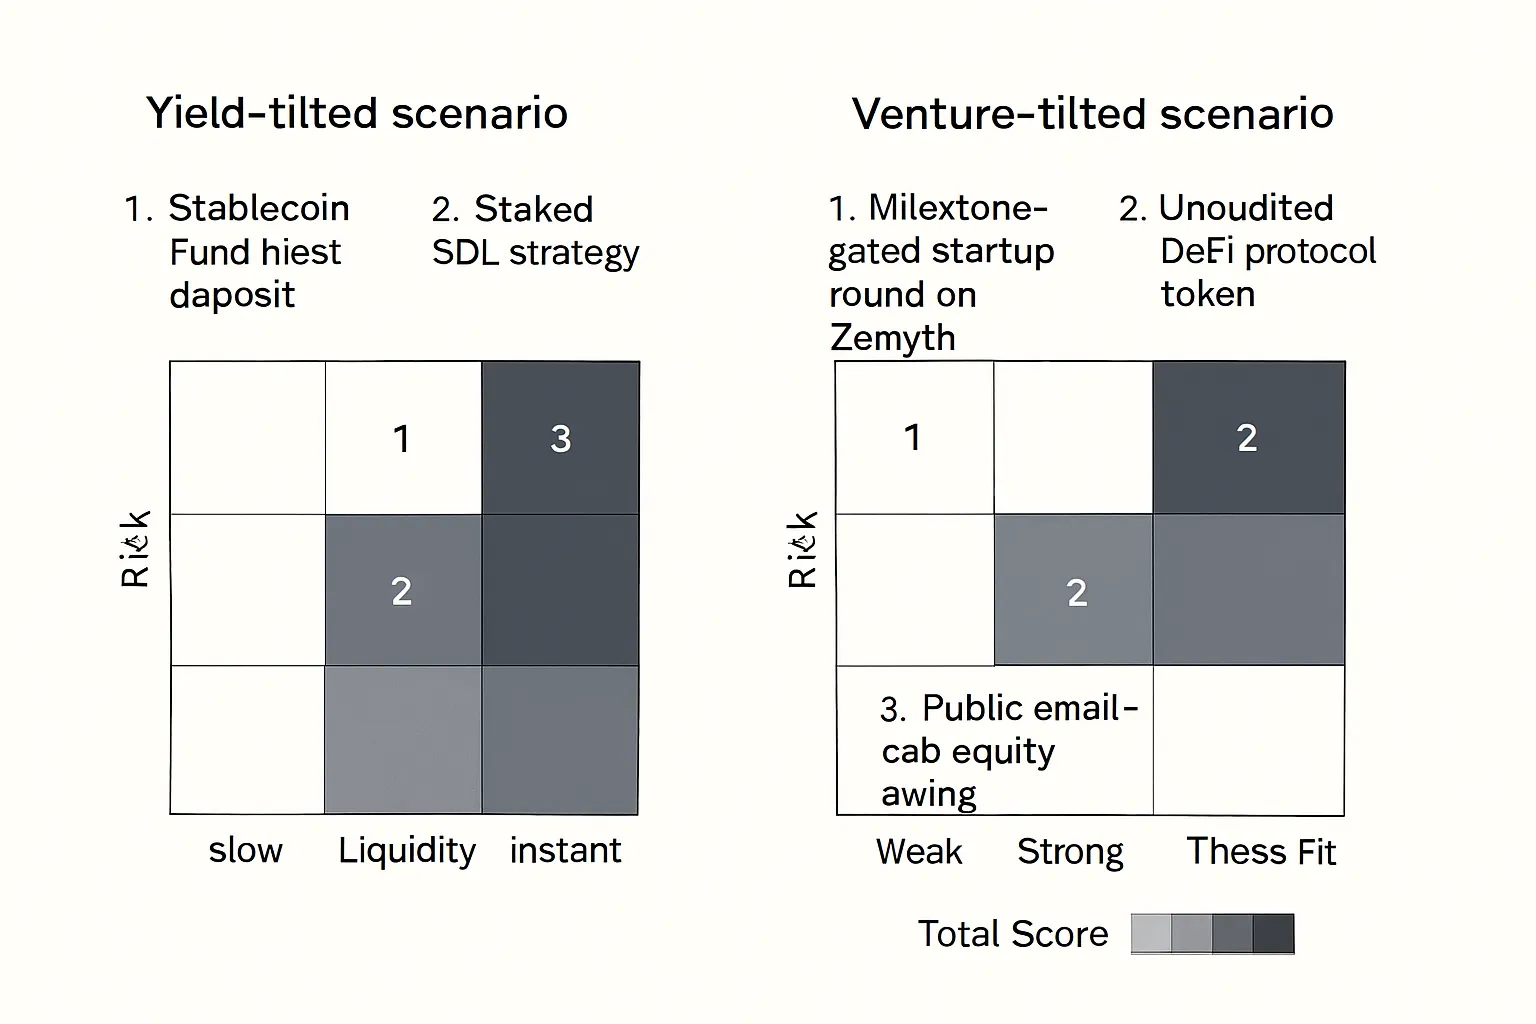
Scenario A (Yield‑tilted): You’re prioritizing capital safety and flexibility for the next 60–90 days. Compare:
Stablecoin Fund Nest deposit (Zemyth liquidity layer)
Staked SOL strategy (liquid staking)
NFT‑collateral lending pool
Scenario B (Venture‑tilted): You’re aiming for upside with clear execution proof. Compare:
Milestone‑gated startup round on Zemyth
Unaudited DeFi protocol token
Public small‑cap equity swing
Below, we walk the weights and scores, compute totals, rank each option, and call out the trade‑offs you accept when you select your investment from dissimilar choices.
Example Weighted Scores
Option | Profile | Weights (R/L/T/C) | Scores (R/L/T/C) | Risk x W | Liquidity x W | Thesis Fit x W | Catalyst x W | Total | Rank |
|---|---|---|---|---|---|---|---|---|---|
Stablecoin Fund Nest deposit | Yield‑tilted | 0.40/0.40/0.20/0.00 | 4/5/4/0 | 1.60 | 2.00 | 0.80 | 0.00 | 4.40 | 1 |
Staked SOL strategy | Yield‑tilted | 0.40/0.40/0.20/0.00 | 3/4/3/0 | 1.20 | 1.60 | 0.60 | 0.00 | 3.40 | 2 |
NFT‑collateral lending pool | Yield‑tilted | 0.40/0.40/0.20/0.00 | 2/2/2/0 | 0.80 | 0.80 | 0.40 | 0.00 | 2.00 | 3 |
Milestone‑gated startup (Zemyth) | Growth‑tilted | 0.30/0.20/0.40/0.10 | 3/1/5/4 | 0.90 | 0.20 | 2.00 | 0.40 | 3.50 | 1 |
Small‑cap equity swing | Growth‑tilted | 0.30/0.20/0.40/0.10 | 3/5/3/3 | 0.90 | 1.00 | 1.20 | 0.30 | 3.40 | 2 |
Unaudited DeFi protocol token | Growth‑tilted | 0.30/0.20/0.40/0.10 | 1/4/2/2 | 0.30 | 0.80 | 0.80 | 0.20 | 2.10 | 3 |
Notes:
Yield‑tilted weights: Risk 0.40, Liquidity 0.40, Thesis Fit 0.20, Catalyst 0.00.
Growth‑tilted weights: Risk 0.30, Liquidity 0.20, Thesis Fit 0.40, Catalyst 0.10.
Interpreting the ranks and trade‑offs
Yield‑tilted (capital parking):
Stablecoin Fund Nest deposit (4.40): Highest liquidity and strong risk controls; best for keeping cash nimble without parking your investment portfolio in volatile assets.
Staked SOL (3.40): Higher market risk and potential validator/protocol risk; better yield but more drawdown and depeg/derivative basis risk if using liquid staking.
NFT lending (2.00): Thin liquidity and collateral volatility; yield can be attractive but tail risk is real.
Venture‑tilted (upside with proof):
Milestone‑gated startup on Zemyth (3.50): Illiquid but high thesis fit and clear catalysts via milestone unlocks; capital follows execution.
Small‑cap equity swing (3.40): Liquid with identifiable catalysts, but public‑market beta and gap risk apply.
Unaudited DeFi token (2.10): Liquid but low thesis fit and high protocol/contract risk; catalysts speculative.
How to validate each score (fast due diligence links and artefacts)
Yield‑tilted
Stablecoin Fund Nest deposit
Risk: Review program docs/treasury policy, counterparty diversification, guardian/multisig.
Liquidity: Redemption terms and settlement windows; recent inflow/outflow history.
Thesis Fit: Internal mandate notes for cash‑management layer.
Staked SOL strategy
Risk: Validator set composition, LST smart‑contract audits, historical depeg events, slashing records.
Liquidity: DEX/AMM depth (Orca/Raydium), pegged derivative spreads, unbonding periods.
Thesis Fit: Yield sleeve guidelines and risk budget.
NFT‑collateral lending pool
Risk: Oracle design and liquidation mechanics; historical bad debt; audit reports.
Liquidity: Borrow/lend utilization, pool depth, time‑to‑liquidate under stress.
Thesis Fit: Whether exotic collateral fits your investment constraints.
Venture‑tilted
Milestone‑gated startup on Zemyth
Risk: Team track record, market mapping, tranche criteria; milestone definitions and on‑chain proofs.
Liquidity: Expected lockup; secondary/OTC terms (if any).
Catalyst: Roadmap commits, customer letters, revenue or user proofs.
Unaudited DeFi protocol token
Risk: Audit status (firm, scope), bug bounty, admin key/upgradeability; treasury runway.
Liquidity: DEX depth and CEX volume; volatility and realized variance.
Catalyst: Shipping cadence, governance pipeline; upcoming releases.
Public small‑cap equity swing
Risk: Balance sheet, cash runway, sector beta; event risk (earnings, FDA, etc.).
Liquidity: Average daily volume, spread, borrow cost (if hedging).
Catalyst: Calendar events, insider transactions, guidance trends.
Bottom line: this matrix lets you invest select across apples and oranges - stable yields, tokens, venture rounds - by the same rules. Rank, understand the trade‑offs, and document why your investment makes sense before you click buy.
Customize the Matrix to Your Strategy (Angels, DAOs, Yield Seekers)
One size never fits all. Tune your matrix to reflect your edge, mandate, and constraints so you can select invest opportunities faster - without drifting from your thesis. Below are battle‑tested profiles and the tweaks that make them work in the real world.
Angels / Early‑stage contributors
Emphasize Thesis Fit, On‑chain Proof, and Team Execution. Add Milestone Credibility so capital follows progress, not promises.
Suggested weights (100‑point total):
Thesis Fit 35–45
Team Execution 20–25
On‑chain/Operational Proof 15–20
Milestone Credibility 10–15
Liquidity 5–10 (acknowledge illiquidity)
Risk 10–15 (focus on controlable risks vs. market noise)
Scoring anchors:
Thesis Fit 5 = exact overlap with your sector, stage, and geo; clear edge to help.
Team Execution 5 = shipped multiple iterations, fast cycle time, crisp metrics.
On‑chain/Operational Proof 5 = verifiable users/revenue, audited contracts, public repos.
Milestone Credibility 5 = milestones are objective, time‑bound, and investor‑controllable (e.g., tranche gates).
Evidence to require:
Milestone doc with acceptance criteria and data sources
Links to audits, dashboards, public traction (e.g., Dune, on‑chain events)
Team references, prior exits, investor updates cadence
Guardrails:
Cap position size if On‑chain Proof <3 or Milestone Credibility <3
Schedule 30/60/90‑day check‑ins to re‑score before follow‑on
DAOs / Investment Committees
You need repeatability, transparency, and governance throughput. Standardize definitions and anchors; require evidence links; formalize weight votes quarterly.
Operating policy:
Publish a criteria glossary with examples and 1–5 anchors per criterion
Require evidence URLs for every score (audits, liquidity depth, founder proof, volatility stats)
Weights are ratified on‑chain or via Snapshot each quarter (with change logs)
Conflict‑of‑interest disclosure prior to scoring; abstain where applicable
Suggested weights (pragmatic default):
Risk 30, Liquidity 25, Thesis Fit 25, On‑chain Proof 10, Catalyst 10
Process flow:
Intake form → auto‑scoring prefill → IC review → on‑chain vote
Quorum requires at least two independent reviewers to sign off on evidence
Auditability:
Store matrices, inputs, and decisions on‑chain/IPFS for immutable history
Create a “decision delta” note whenever rescoring shifts rank order
Yield‑oriented contributors
Cash first, flexibility second, upside third. Heavier Liquidity and Risk weighting; include Counterparty Risk and Drawdown History explicitly.
Suggested weights (100‑point total):
Liquidity 35–45
Risk 35–45 (split into Counterparty 20–25, Market/Duration 10–15, Operational 5–10)
Thesis Fit 10–15 (does it serve your investment portfolio’s base layer?)
Drawdown History 10–15 (peak‑to‑trough and recovery time)
Scoring anchors:
Liquidity 5 = T+0 exit with deep two‑sided markets; slippage <0.25% on position size
Counterparty Risk 5 = diversified, transparent, audited; no single point of failure
Drawdown 5 = max drawdown <2% and recovery <7 days in prior stress
Execution rules:
Position size caps by liquidity tier
Auto‑rebalance when liquidity score drops ≥1 point or spread widens beyond threshold
Pre‑commit stop‑loss or redemption triggers tied to on‑chain metrics
Founders evaluating cap table capital
Flip the script. Use the same matrix to score investors so you select invest partners who accelerate execution.
Criteria and weights (100‑point total):
Value‑Add Fit 35–45 (distribution, design partners, domain expertise)
Liquidity Flexibility 15–20 (milestone‑based tranches, bridge readiness)
Speed & Certainty 15–20 (decision timeline, diligence clarity, re‑ups)
Proof‑based Tranche Alignment 10–15 (comfort with objective gates)
Signaling/Network 10–15 (follow‑on access, brand lift)
Scoring anchors:
Value‑Add Fit 5 = direct intros to ICPs, documented wins, clear post‑close plan
Liquidity Flexibility 5 = milestone‑gated terms, transparent unlock logic
Speed & Certainty 5 = term sheet target date, known IC cadence, references confirm
Outcome:
Rank investors, choose those who compound your roadmap, and design term sheets grounded in proof - not vanity terms
Quick customization checklist
Pick 3–5 core criteria that reflect your edge and risk budget.
Write 1–5 anchors with objective tests and example data for each.
Assign weights that mirror your current mandate (re‑vote quarterly if you’re a DAO).
Set policy guardrails (max single‑criterion weight, position sizing, exit triggers).
Log every decision with links so future‑you - and your stakeholders - can audit your investment logic.
When you tailor the matrix to how you operate, you invest select faster, with fewer debates and better outcomes - and you can defend every move in your investment portfolio with clean, verifiable rationale.
Guardrails: Avoid Common Pitfalls (And Speed Up Without Cutting Corners)
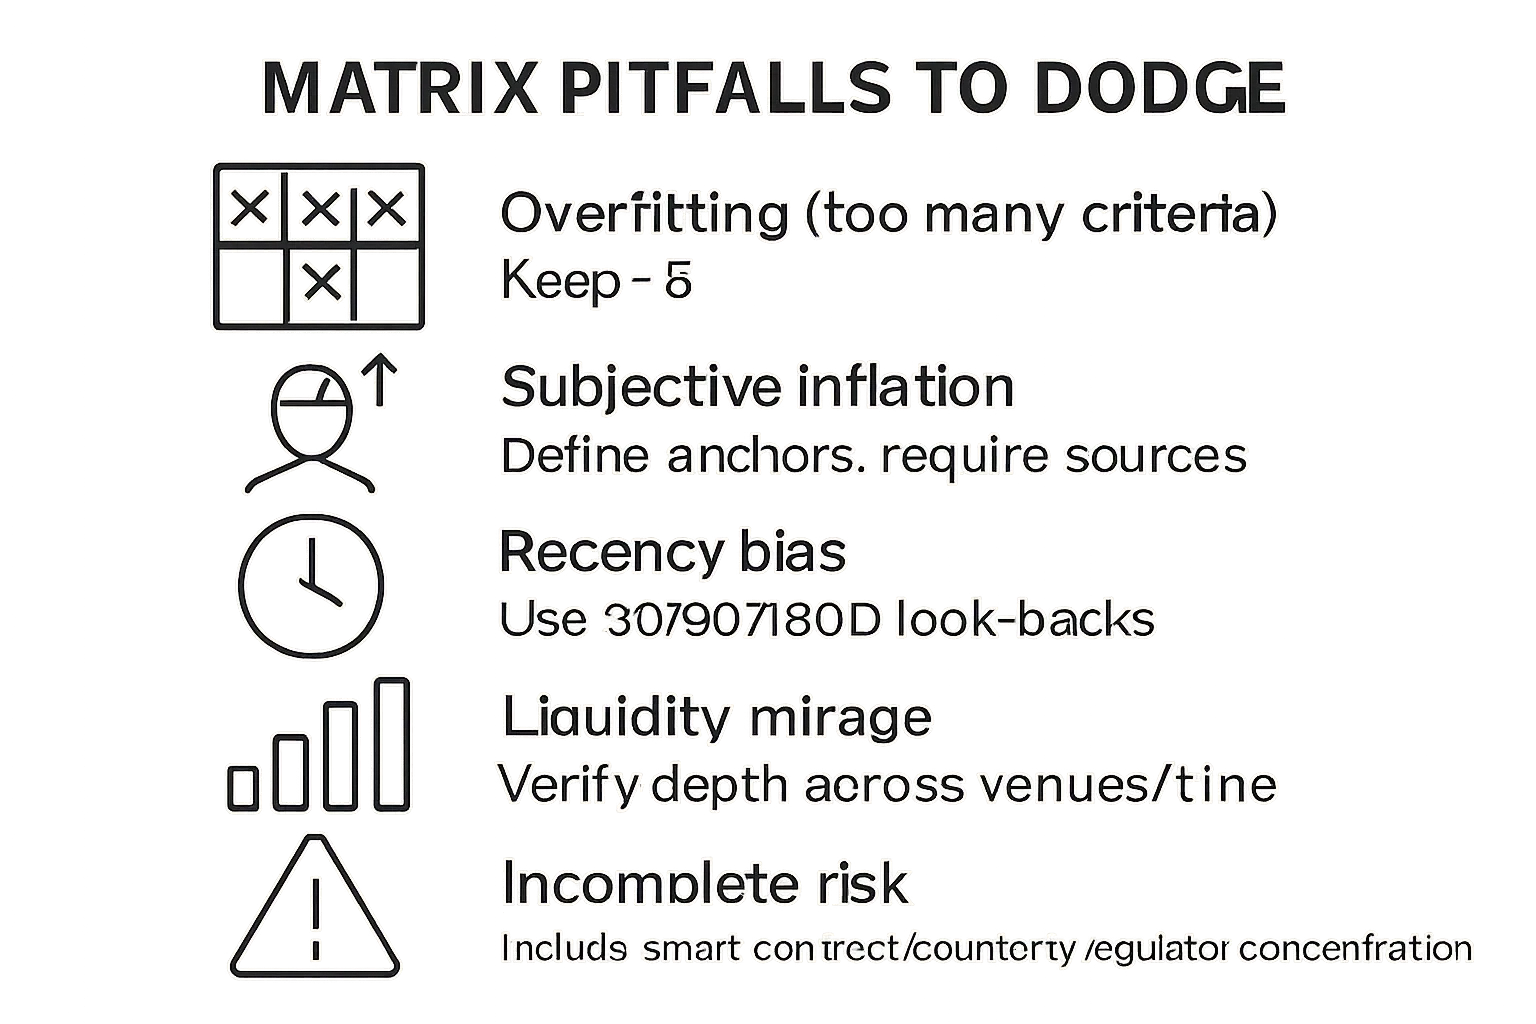
Overfitting: Too many criteria dilute signal. Keep it under five for faster, cleaner decisions.
Subjective inflation: Define 1–5 scoring anchors for each criterion and require evidence links (audits, liquidity depth, founder proof) with every score.
Recency bias: Use look‑back windows and rolling averages (e.g., 30/90/180‑day volatility, returns) so one spike doesn’t sway the decision.
Liquidity mirage: Verify depth across venues and time windows, stress‑test slippage on your actual trade size, and check redemption/lockup terms.
Incomplete risk view: Score smart‑contract, counterparty, regulatory, and concentration risk separately; don’t let a single “Risk” line hide tail risks.
Decision drift: Lock weights for a defined period (e.g., quarter), time‑box review cadences, and document any overrides with rationale and links.
Operational tips:
Cap any single criterion at 50% unless a written policy says otherwise.
Require two‑reviewer sign‑off for scores ≤2 or ≥5 (to combat extremes).
Auto‑trigger a re‑score when evidence links change (new audit, liquidity shift, milestone hit).
Operationalize the Matrix with On‑Chain Proof (Zemyth Workflow)
Why Zemyth for matrix‑driven selection
Milestone‑gated venture rounds: Capital unlocks only with verifiable proof - builds shipped, users acquired, revenue milestones - so funding tracks execution, not hype.
Fund Nest liquidity layer: Park idle capital to earn daily yield and keep dry powder ready for your next select invest decision.
On‑chain transparency on Solana: Contributor reputation, tranche events, and full auditability align stakeholders and reduce ambiguity across your investment portfolio.
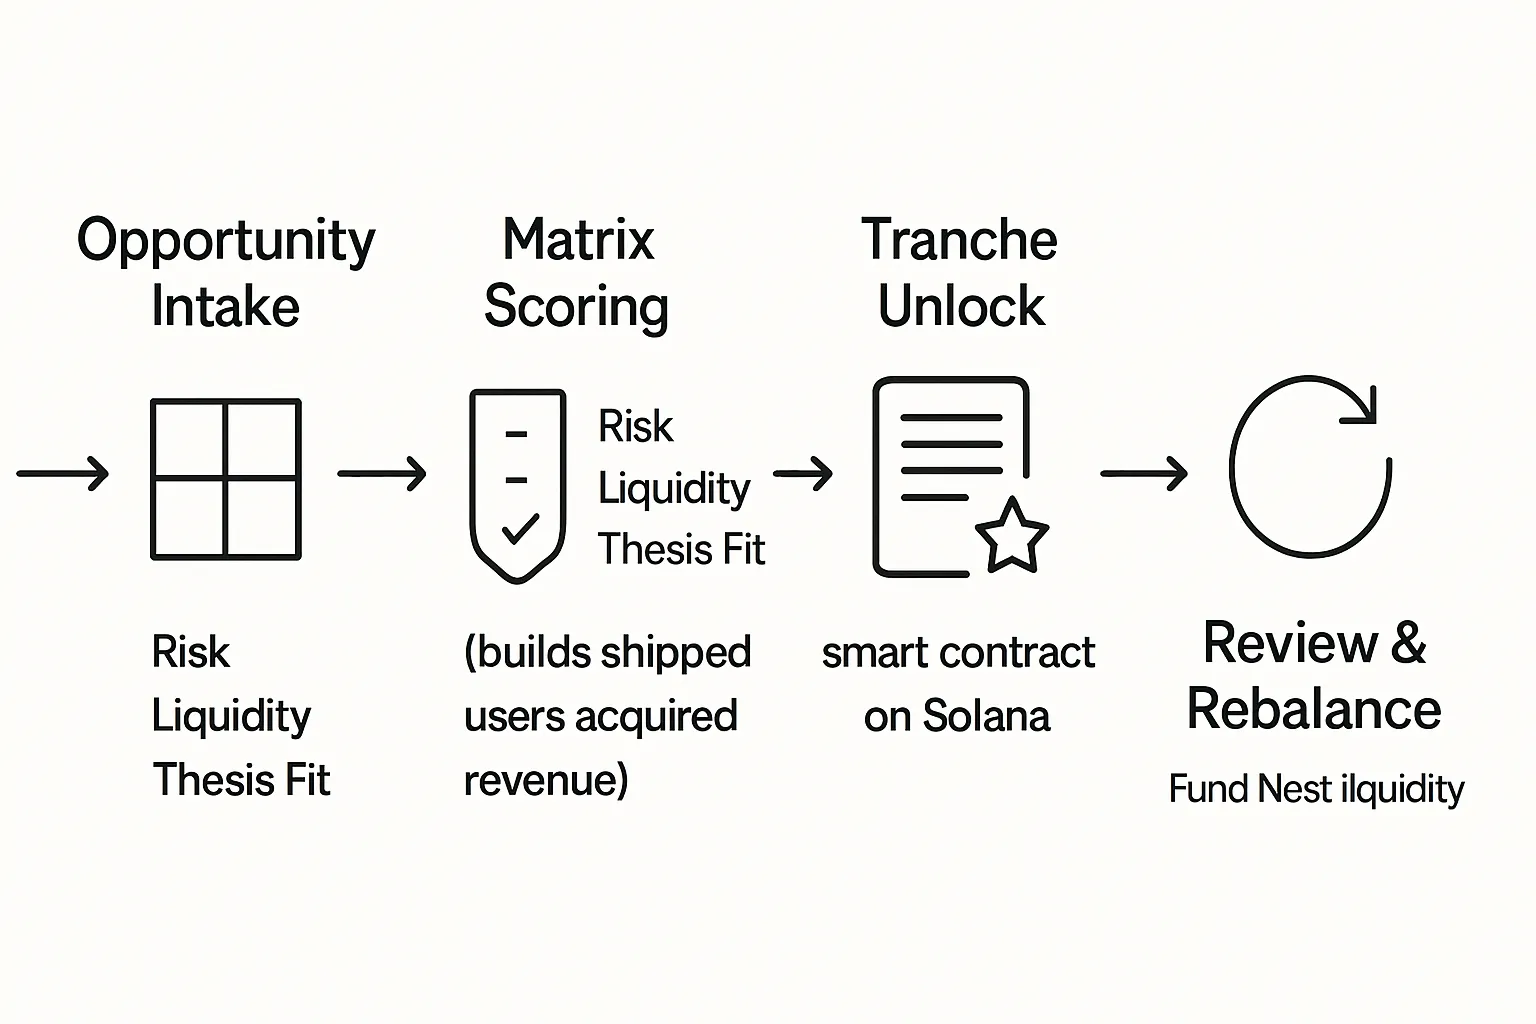
Map your matrix into Zemyth steps
Intake: Attach your matrix and weights to each opportunity card - Startup Nest rounds or Fund Nest allocation moves - so reviewers see the same yardstick you use to invest select.
Evidence: Link audits, KPIs, traction dashboards, wallet analytics, and milestone definitions as proof behind each score.
Decision: Vote/approve with scores visible to stakeholders; record rationales and any overrides on‑chain for immutable accountability.
Review: Set automatic check‑ins; adjust weights quarterly; compare realized vs. expected outcomes and trigger re‑scores when proof changes.
Example: A milestone‑gated round
Criterion definitions align to unlocks:
Thesis Fit: “Users → 10k MAU” or “MRR → $50k” raises score on proof.
Risk: “Audit completed” and “key-man redundancy” reduce protocol/execution risk.
Liquidity: “Secondary arrangements signed” informs exit score and position sizing.
Rebalancing playbook:
Between milestones, sweep excess to Fund Nest to compound daily and preserve flexibility.
On milestone verification, auto‑unlock the next tranche; re‑score, then either top‑up or hold, per your matrix and mandate.
Stress‑Test Your Scores: Sensitivity, Scenarios, and Position Sizing
Stress‑testing keeps a clean matrix honest. Before you commit capital, shake the inputs to see how fragile your ranking is - and set rules that protect your investment portfolio when conditions change.
Sensitivity
Weight sensitivity: Nudge your Risk weight ±10–20% (reallocate the difference proportionally from other criteria) and note whether the top two selections change. If they flip, your selection is weight‑sensitive - raise diligence or reduce size.
Score sensitivity: Drop Liquidity by one notch (e.g., 4→3) and rerun totals. Repeat for Risk (e.g., 3→2). If a one‑step change knocks an asset out of the top half, treat it as fragile and cap exposure.
Tie‑breaker protocol: If totals are within 0.2–0.3 (on a 5‑point scale), use a deterministic tie‑breaker order: Liquidity > Risk > Thesis Fit > Catalyst. This keeps invest select decisions consistent.
Scenario analysis
Define bull/base/bear for returns and catalysts:
Venture: Bull = milestone hit early + user/revenue beat; Base = on‑time delivery; Bear = slippage + KPI miss.
Yield: Bull = stable rates + deep liquidity; Base = rate drift ±50 bps; Bear = liquidity drain + spread widening.
One variable at a time: Change only one assumption per run (e.g., catalyst timing, liquidity depth, or volatility). Then test combined stresses for a worst‑case snapshot.
Decision impact: For each scenario, tag the action you’d take (add/hold/trim/exit) and the specific evidence you’d need to pull the trigger.
Position sizing rules (by Risk/Liquidity bands)
Define bands (1–5 anchors from your matrix) and translate to max position sizes:
Low Risk (4–5) + High Liquidity (4–5): max 8–12% per line; total sleeve cap 35–50%.
Medium Risk (3) + Medium Liquidity (3): max 4–7%; sleeve cap 20–30%.
High Risk (1–2) or Low Liquidity (1–2): max 1–3%; require incremental proof for adds.
Correlation clusters: Cap exposure by cluster so one shock doesn’t sink the book:
Chain/venue cluster (e.g., Solana DeFi): ≤25–35% aggregate.
Sector cluster (e.g., LSTs, NFT‑finance, small‑cap biotech): ≤20–30%.
Counterparty cluster (same custodian/oracle/market maker): ≤15–25%.
Pacing: Stagger entries across time windows (e.g., thirds over 7–10 days) for assets with liquidity score ≤3.
Exit rules and review triggers
Hard triggers:
Milestone miss or re‑scope that breaks the original thesis.
Liquidity deterioration: liquidity score drops ≥1 point or expected slippage doubles on your trade size.
Risk events: new critical audit findings, admin‑key changes, regulatory notices, counterparty stress.
Volatility breach: realized vol > threshold for X days (define by asset class).
Soft triggers:
Catalyst delay beyond tolerance window (e.g., >30 days).
Reputation signal shifts (team turnover, governance conflicts).
Actions:
Reduce by 25–50% on first hard trigger; re‑score before any re‑add.
Move proceeds to your liquidity sleeve (e.g., Fund Nest) until the next green signal.
For venture tranches, pause further unlocks until proof is verified.
Documentation and feedback loop
Version the matrix: Save the pre‑trade matrix, stress variants, and the final decision with links (audits, DEX depth, KPI dashboards).
Change log: Every override or size change gets a timestamped note with “what changed,” “why,” and the evidence URL.
Post‑mortem: At 30/90 days, compare projected vs. realized (returns, catalyst timing, liquidity, drawdown). Adjust anchors or weights if a pattern emerges - then lock them for the next period to prevent drift.
Score drift guard: If realized outcomes repeatedly deviate from the matrix in one criterion (e.g., Liquidity), refine its anchors before adjusting the weight.
Quick stress‑test checklist
Run ±10–20% weight sensitivity; record any rank flips.
Shift Liquidity and Risk down one notch; cap fragile positions.
Map bull/base/bear with one‑variable changes; pre‑tag actions.
Apply banded position sizing and cluster caps.
Set hard/soft exit triggers and automate review reminders.
Log everything - so future‑you can see why your investment was sized and timed the way it was.
FAQs: Using a Scoring Matrix to Select Your Investment
What criteria should every investor include?
Start with Risk, Liquidity, and Thesis Fit. Add 1–2 custom criteria tied to your edge (e.g., Catalyst/Timeline, On‑chain Proof, Expected Return). Keep it under five to avoid diluting signal.
How often should I revisit weights?
Quarterly, or immediately when your strategy changes materially (e.g., shifting from growth to yield). Lock weights for each period to prevent decision drift and keep select invest choices consistent.
Can this work for traditional equities and crypto?
Yes. The framework is asset‑agnostic. Adapt anchors and data sources: for equities use filings, earnings calendars, liquidity/ADV, and volatility; for crypto use audits, DEX depth, chain analytics, and protocol risk. Same matrix, different evidence.
How do I keep bias low?
Define 1–5 anchors for each criterion, attach evidence links (audits, liquidity, KPIs), use multi‑reviewer scoring, and log decisions on‑chain when possible. This turns invest select calls into a repeatable, auditable process.
What if two options tie?
Use deterministic tie‑breakers: higher liquidity wins; if equal, choose stronger near‑term catalysts; if still equal, prefer better downside protection (lower drawdown history, diversified counterparties). If totals remain within a narrow band, size both smaller rather than forcing a false winner.
How do I apply this to my investment portfolio without slowing down?
Pre‑set your criteria, weights, and anchors once. Then each new opportunity takes minutes: score, sort, sanity‑check, select your investment, and document why your investment fits the mandate.
Can I use this for short‑term parking and long‑term bets?
Absolutely. Weight Liquidity and Risk higher for cash parking; weight Thesis Fit and Catalysts higher for venture‑style bets. The same matrix helps you select invest options across both sleeves and rebalance with intent.
What’s the minimum process for solo operators?
Three criteria, fixed weights, evidence link per score, and a one‑page log of each decision. That’s enough to make faster, cleaner invest select calls and improve over time.
Conclusion: Make Better Picks, Faster - Start with Zemyth
A simple 3–5‑criteria matrix turns noise into signal. By scoring Risk, Liquidity, Thesis Fit (and 1–2 custom criteria), you select invest opportunities objectively, reduce bias, and document your investment decisions so you can learn, iterate, and compound smarter across your investment portfolio.
Action plan in one sentence: define the objective, set weights, score options, rank, and log - then execute with milestone‑gated proof and a liquid base layer so every invest select decision is intentional and accountable.
Use Zemyth to operationalize your scoring matrix end‑to‑end - co‑fund credible founders via Startup Nest, park idle capital in Fund Nest for daily yield, and keep your investment portfolio transparent and auditable on‑chain. Start now: https://zemyth.app